Definitions and Data
| well-being - Used here as a synonym for HDI (Human Development Index). See HDR 2011 below. |
| fairness - Used here as an umbrella term for both equity (fairness among a population) and sustainability (fairness across generations). |
| equity - Fairness among populations, whether at community, national, regional, or global levels. The HDR addresses many aspects of inequality, including life expectancy, schooling, income, gender inequality, and standard of living. |
| sustainability - Fairness across generations. Some components of sustainability the HDR focuses on: carbon dioxide emissions, endangered species, forest area, fresh water withdrawals, greenhouse gases, and impact of natural disasters. |
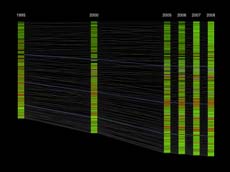
The UNDP published a variety of datasets with the HDR (data). The data covers a wide range of issues, at varying degrees of granularity. Some data has been collected periodically since 1980. Some data exists for only one or two years. Other datasets cover a long span of years, but only has sparse data for a handful of countries. The data presented in the graph above covers only a small sample of the available data. The equity and sustainability data slices shown here are are among the few that have good coverage across most countries over a range of more than a couple years. The three datasets used here were trimmed to the years they have in common (1995, 2000, 2005, 2006, 2007, and 2008).
| HDI - The Human Development Index value for 194 countries. The available data includes 2011, and goes back to 1980, but the set was trimmed to the years overlapping the equity and sustainability datasets. The IHDI (Inequality-adjusted HDI value) discounts the HDI based on the level of inequality. IHDI could be more a more telling figure in this graph, but it is only available for 2011. |
| equity - The HDR accounts for several factors in judging equality (commonly it's converse, inequality). Most of the inequality-related data covers only one or two years, or relatively few countries across a range of years. The data for female-male labor force participation ratio represents a measure for equity here. Labor force participation data is available for 177 of the 194 countries in the HDI dataset, and it spans 1980 to 2009. |
| sustainability - Similarly, the HDR addresses several issues regarding sustainability. Only two sustainability datasets span more than a year or two: Carbon Dioxide Emissions per capita, and Forest Area. Carbon dioxide emissions is presented here, spanning 1995 to 2008. |
Questions
The UNDP's 2011 Human Development Report (HDR) argues that progress in human well-being, as indicated by the Human Development Index (HDI), requires improved equity among the 7 billion of us here now, and sustainable practices so that well-being can persist to future generations. The interactive graph above presents HDR data in an attempt to explore this question:
- How have levels of well-being (HDI) changed over time?
- How has distribution changed?
- Is well-being equitable and sustainable in countries and regions with very high HDI levels?
- How has equity changed over time (since we have been collecting and tracking data)?
- How has sustainability changed over time?
The Graph - To Do and Notice
Tilted Scatter Plot
| This is really just a conventional scatter plot, with a couple widgets added for filtering by HDI level or year. Echoing the diamond graphic in the HDR, this graph is tilted to connote how equity and sustainability are parallel goals, and to suggest how improvements in both are required in order to arrive at the peak of human development at the top of the chart. | 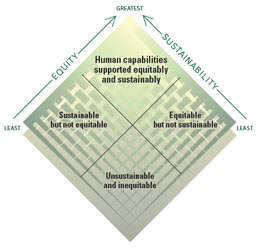 |
Country Details
| Hovering the mouse over a country dot brings up the specific data for that country that year. | 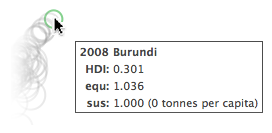 |
HDI levels
The 194 countries make for a relatively dense scatterplot. The HDR speaks about HDI levels (quartiles of ranked HDI). You can select a single level to view by clicking the Very High, High, Medium, or Low levels at the lower-right. Cmd-click additional levels to see combinations.
Select Years
You can click any combination of years to view at once. Clicking a single year will show values for that year. Select additional years by cmd-clicking others.
Dot Size
The checkbox at the lower-left lets you switch between viewing countries as dots, or as rings that are sized by the country's HDI value for a given year.HDR 2011
The 2011 Human Development Report states "Human development is the expansion of people's freedoms and capabilities to lead lives that they value and have reason to value. It is about expanding choices." The Human Development Index derives from numerous data sources to provide a numeric indicator of human development. The HDI is comprised of three main components: a long and healthy life, knowledge, and a decent standard of living. In the graph above, each country is depicted with a circle that is sized by the country's HDI for the selected year.
The report emphasizes how inequality (poverty, lack of female empowerment, etc.) hampers human development, and how lack of sustainability (ecological and otherwise) stifles progress of human development to coming generations. In a sense, inequality and sustainability are place and time components of broad fairness. Inequality has to do with fair distribution of opportunity among the current population. In turn , sustainability is the fair distribution of opportunity across generations. The report further underscores how inequality and sustainability are intertwined.
Links
Human Development Report 2011
Human Development Report 2011 Data
UNDP's Tools and Visualizations
HDI at Wikipedia
Visualizing.org challenge
more: